
Page 3 - Combined_40_OCR
P. 3
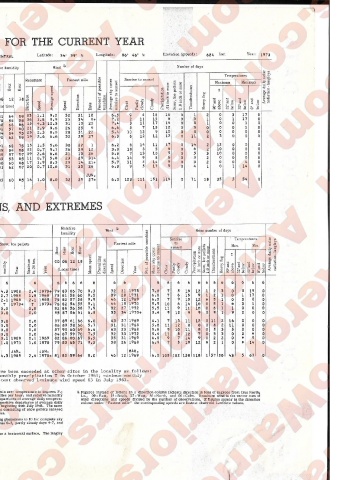
METEOROLOGICAL DATA FOR THE CURRENT YEAR
Station: HUNTSVILLE/ ALABAMA HUNTSVILLE-MADISON COUNTY AP Standard time used: CENTRAL Latitude: Longitude: Elevation (ground) :
Temperature Degree days Precipitation Relative humidity Number of days
Temperatures
(Base 65°)
Extremes Snow, Ice pellets Resultant Fastest mile Sunrise to sunset
(Local time)
NORMALS, MEANS, AND EXTREMES
Relative Wind &
Temperature Precipitation humidity Mean number of days
Normal heating degree EC EC jn0H | Pct. of possible sunshine | sunrise to sunset 1Snow, Ice pellets ** Average daily solar radiation - langleys
Temperatures
to
Normal Extremes Snow, Ice pellets o 1 Fastest mile Sunrise Max. Min.
sunset
Mean speed
x: maximum minimum highest days (Base 65°) Normal total Maximum monthly Minimum monthly Maximum in 24 hrs. Mean total Maximum monthly Maximum in 24 hrs. 00 06 12 “ 1Prevailing | direction | Direction 1Mean sky cover o Precipitation | .01 inch or more 11.0 inch or more 1Thunderstorms | Heavy fog 90°and co o •o S
s
§ 5
o Daily Daily Monthly Record Year’ Record lowest Year Year Year Year Year Year (1-oca tim CO g. Year J Clear 1Partly | cloudy O 1above oi *2 cm a; o
CO
Z | co 1
(a) (b) (b) (b) 6 6 (b) (b) 6 6 6 6 6 6 6 6 6 6 6 6 6 6 6 6 6 6 6 6 6 6 6 6 6
J 50.5 31.3 40.9 76 1972 3 1970 747 5.13 7.97 1972 1.71 1970 2.95 1969 1.4 4.3 1968 2.4 1970 + 79 83 66 70 9.3 32 21 1973 7.0 7 5 19 12 1 2 3 0 3 19 0
F 54.0 33.2 43.6 75 1972 7 1970 605 5.16 9.57 1971 1.14 1968 3.86 1971 1.1 2.7 1968 1.8 1968 75 81 58 60 9.5 39 28 1971 6.6 7 6 15 9 1 2 1 0 1 17 0
M 61.7 39.8 50.8 82 1968 19 1969 461 5.79 14.77 1973 3.00 1969 7.70 1973 0.4 2.1 1968 2.1 1968 75 82 57 58 9.9 46 12 1969 6.5 7 9 15 12 * 5 1 0 0 8 0
A 73.1 50.2 61.7 90 1971 30 1973 145 4,79 9.08 1970 3.29 1971 2.62 1970 T T 1973+ T 1973 + 76 82 54 55 9.1 44 18 1970 5.9 10 6 14 10 0 5 1 F. 0 1 0
M 80.9 58.3 69.6 92 1970 36 1971 32 3.86 6.85 1969 3.06 1970 4.25 1969 0.0 0.0 0.0 82 86 56 58 7.9 32 27 1972 5.5 11 9 11 10 0 6 1 1 0 0 0
J 87.9 65.9 76.9 101 1969 45 1972 0 3,97 6.61 1970 0.77 1968 4.46 1969 0.0 0.0 0,0 85 87 56 61 6.8 35 34 1970 + 5.4 9 12 9 9 0 9 1 9 0 0 0
J 90.2 68.8 79.5 101 1969 54 1972 0 4,88 9.44 1973 2.44 1970 2.19 1971 0.0 0.0 0.0 87 39 61 66 6.0 43 27 1969 6.1 7 13 11 12 0 11 2 16 0 0 0
A 90.2 67.7 79.0 101 1968 57 1972 0 3,46 4.04 1970 0.93 1973 1.95 1970 0.0 0.0 0.0 86 89 58 66 5.7 31 31 1968 5.0 11 12 8 8 0 8 2 11 0 0 0
S 84.2 61.6 72.9 95 1970 43 1972 11 3,29 5.99 1971 1.78 1973 2.31 1971 0.0 0.0 0.0 87 90 60 69 6.4 43 23 1968 5.6 9 10 11 8 0 5 3 5 0 0 0
□ 74.5 49.8 62.2 89 1968 30 1968 159 2.57 4.76 1970 0.77 1971 1.67 1973 0.0 0.0 0.0 84 87 59 70 7.5 32 33 1972 5.4 11 8 12 7 0 3 3 0 0 * 0
N 61.6 38.9 50.3 80 1971 + 15 1970 441 3,88 6.79 1973 1.82 1971 3.33 1973 T 0.1 1969 0.1 1969 82 86 60 67 8.5 35 31 1969 6.0 9 7 14 9 0 2 2 0 ♦ 9 0
D 52.1 32.7 42.4 77 1970 14 1968 701 5,38 9.89 1971 4.73 1970 5.81 1973 0.2 1.0 1970 1.0 1970 79 83 65 71 9.5 38 26 1968 6.9 7 5 19 12 * 2 1 0 ♦ 14 0
JUL. JAN. MAR. OCT. MAR. JAN. JAN. MAR.
YR 71.7 49.9 60.8 101 1969 + 3 1970 3302 52,16 14.77 1973 0.77 1971 + 7.70 1973 3.1 4.3 1968 2.4 1970 + 81 85 59 64 8.0 46 12 1969 6.0 105 102 158 118 1 57 20 43 5 67 0
Means and extremes above are from existing and comparable exposures. Annual extremes have been exceeded at other sites in the locality as follows:
Highest temperature 104 in July 1966; lowest temperature -11 in January 1966; minimum monthly precipitation T in October 1963; maximum monthly
snowfall 21.4 in December 1963; maximum snowfall in 24 hours 17.1 in December 1963; fastest observed 1-minute wind speed 63 in July 1963.
(a) Length of record, years, based on January data. Unless otherwise indicated, dimensional units used in this bulletin are: temperature in degrees F.; & Figures instead of letters in a direction column indicate direction in tens of degrees from true North;
Other months may be for more or fewer years if precipitation, including snowfall, in inches; wind movement in miles per hour; and relative humidity i.e., 09-East, 18-South, 27-West, 36-North, and 00-Calm. Resultant wind is the vector sum of
there have been breaks in the record. in percent. Heating degree day totals are the sums of negative departures of average daily tempera wind directions and speeds divided by the number of observations. If figures appear in the direction
(b) Climatological normals (1941-1970) . tures from 65° F. Cooling degree day totals are the sums of positive departures of average daily column under "Fastest mile" the corresponding speeds are fastest observed 1-minute values.
* Less than one half. temperatures from 65° F. Sleet was included in snowfall totals beginning with July 1948. The term
+ Also on earlier dates, months, or years. "Ice pellets" includes solid grains of ice (sleet) and particles consisting of snow pellets encased
T Trace, an amount too small to measure. in a thin layer of ice. Heavy fog reduces visibility to 1/4 mile or less.
— Below zero temperatures are preceded by a minus sign,
t > 70° at Alaskan stations. Sky cover is expressed in a range of 0 for no clouds or obscuring phenomena to 10 for complete sky
cover. The number of clear days is based on average cloudiness 0-3, partly cloudy days 4-7, and
The prevailing direction for wind in the Normals, cloudy days 8-10 tenths.
Means, and Extremes table is from records through
1963. Solar radiation data are the averages of direct and diffuse radiation on a horizontal surface. The langley
denotes one gram calorie per square centimeter.