
Page 5 - Combined_73_OCR
P. 5
scale models and a very limited study of a full scale model. Specific
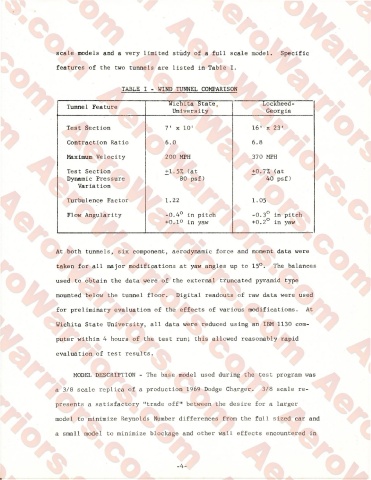
features of the two tunnels are listed in Table I.
TABLE I - WIND TUNNEL COMPARISON
Wichita State, Lockheed-
Tunnel Feature
University Georgia
Test Section 7’ x 10’ 16’ x 23’
Contraction Ratio 6.0 6.8
Maximum Velocity 200 MPH 370 MPH
Test Section +1.5% (at +0.7% (at
Dynamic Pressure 80 psf) 40 psf)
Variation
Turbulence Factor 1.22 1.05
Flow Angularity -0.4° in pitch -0.3° in pitch
+0.1° in yaw +0.2° in yaw
At both tunne I — * c n six component, aerodynamic force and moment data were
taken for all major modifications at yaw angles up to 15°. The balances
used to obtain the data were of the external truncated pyramid type
mounted below the tunnel floor. Digital readouts of raw data were used
for preliminary evaluation of the effects of various modifications. At
Wichita State University, all data were reduced using an IBM 1130 com
puter within 4 hours of the test run; this allowed reasonably rapid
evaluation of test results.
MODEL DESCRIPTION - The base model used during the test program was
a 3/8 scale replica o iw a production 1969 Dodge Charger. 3/8 scale re-
presents a satisfactory ’’trade off” between the desire for a large
model to minimize Reynolds Number differences from the full sized car and
a small model to minimize blockage and other wall effects encountered in
-4-